Project
Kimia Farma Business Performance Dashboard
Technology
SQL, Looker Studio, Data Warehousing, Data Mart
Year
2024
Source Code
Description
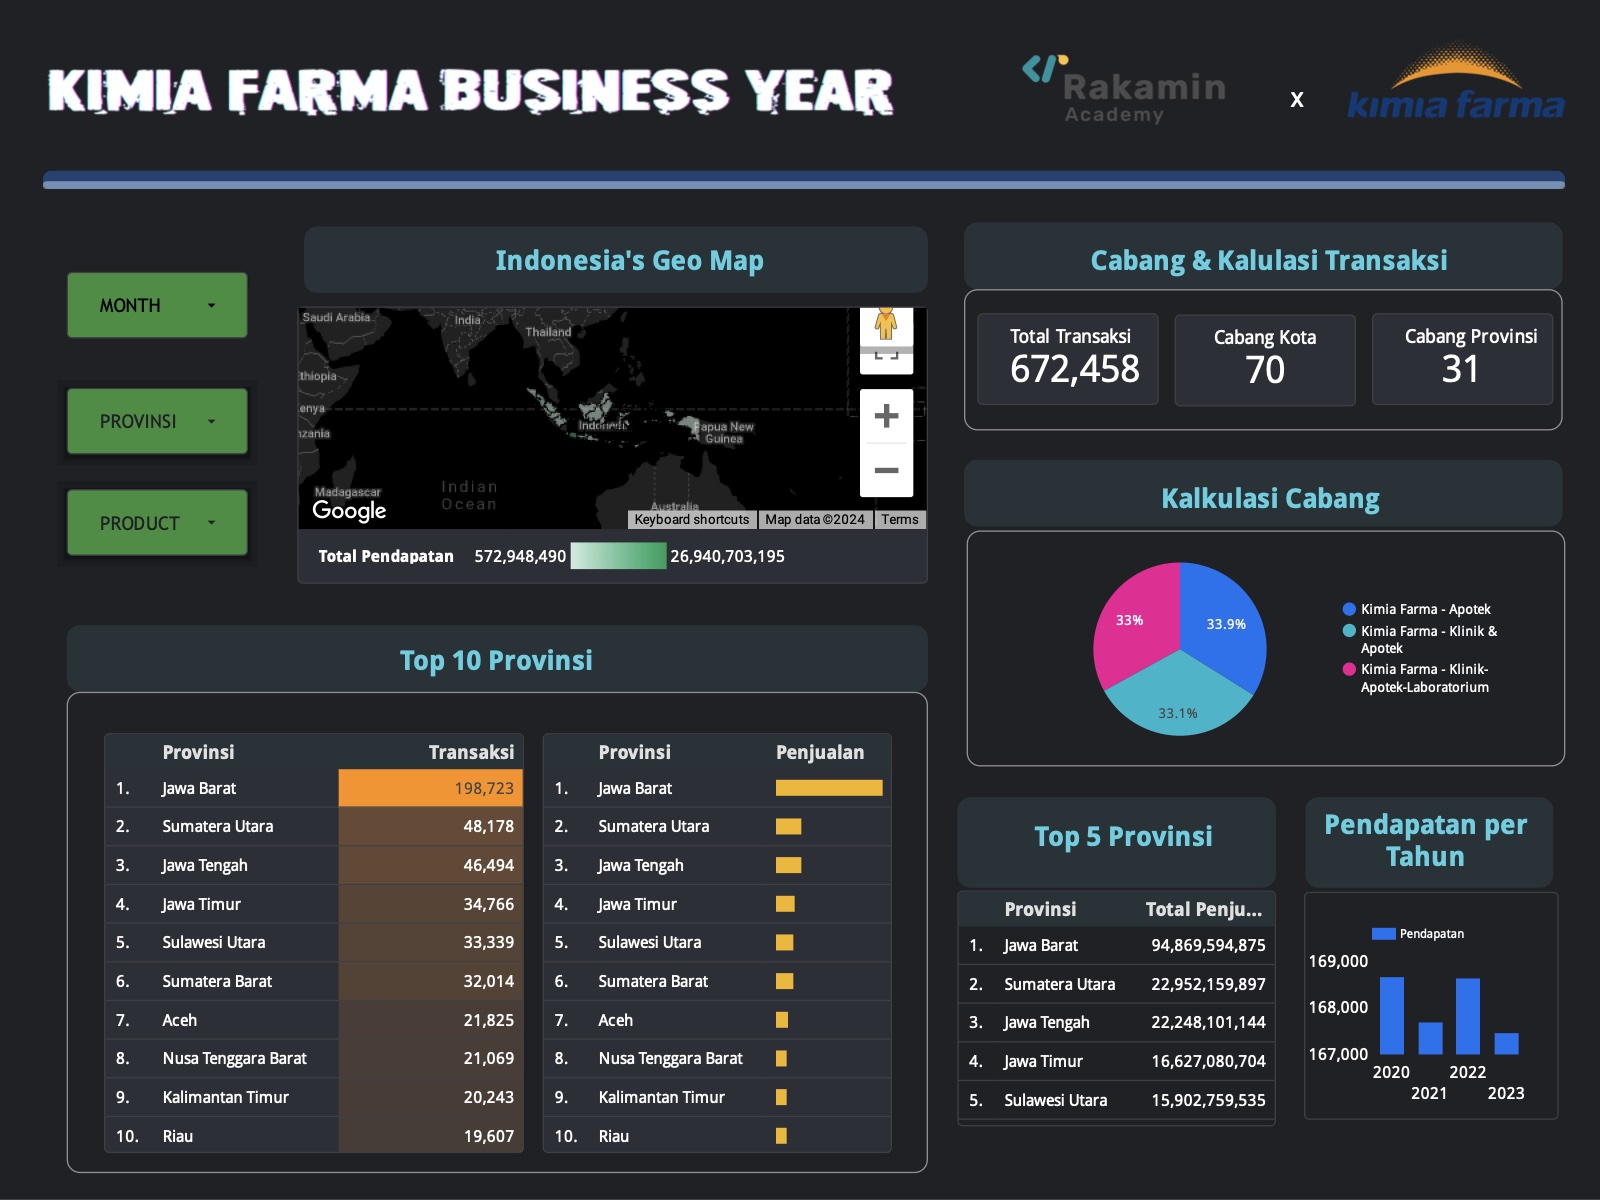
Final project of the Kimia Farma Big Data Analytics virtual internship with Rakamin Academy. Transaction, product, inventory, and branch data were combined into an analysis table to evaluate Kimia Farma's business performance from 2020 to 2023.
The interactive dashboard shows total transactions (672,458), branches across 70 cities and 31 provinces, the share of each branch type, the top provinces by transactions and sales, and revenue per year, with filters by month, province, and product.